Paul Michael
April 14, 2025
Amazon continues to dominate e-commerce in 2025, shaping global retail and redefining customer expectations. With massive sales volume, unmatched customer reach, and a thriving third-party seller ecosystem, Amazon’s data tells the story of its influence.
In this article, we’ve pulled together the latest Amazon statistics—from user counts to seller performance, revenue streams, and marketplace dynamics. Whether you’re analyzing trends or building a strategy, this statistic-packed resource has you covered.
TL;DR: Amazon Quick Stats (2025)
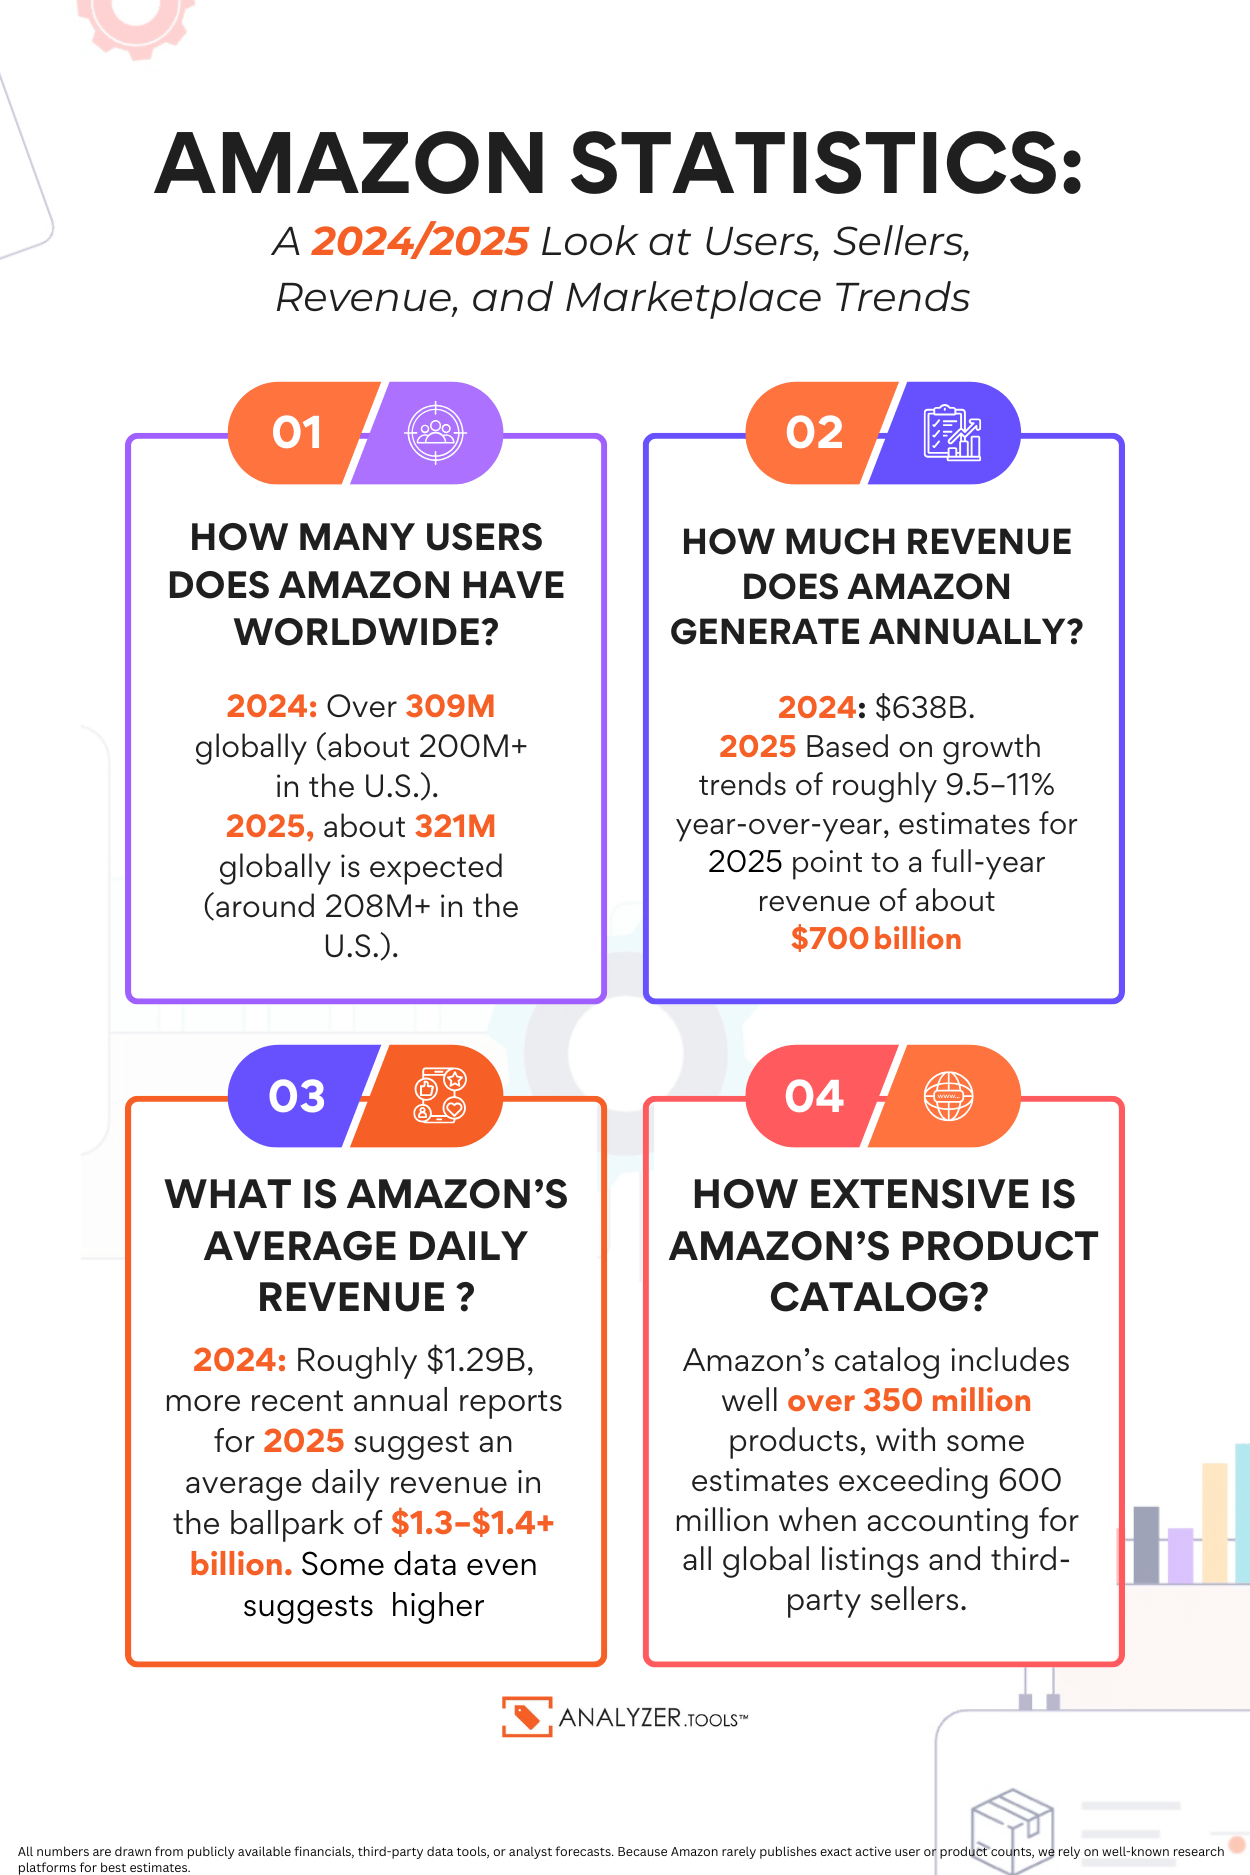
- How Many People Used Amazon in 2024? Over 309M globally (majority of estimates show ~200M+ in the U.S.).
- How Many People Will Use Amazon in 2025? Based on modest growth assumptions of roughly 4% year-over-year, estimates for 2025 suggest a global user base of about 321M (with roughly 208M+ in the U.S.).
- How Much Revenue Did Amazon Generate in 2024? $638B
- How Much Revenue Will Amazon Generate in 2025? Based on growth trends of roughly 9.5–11% year-over-year, estimates for 2025 point to a full-year revenue of about $700 billion.
- How Much Money Does Amazon Make Per Day? ~$1.29B, more recent annual reports suggest an average daily revenue in the ballpark of $1.3–$1.4 billion
- How Many Sellers on Amazon? ~9.7M reported globally in early 2025, ~1.9M+ in the U.S.
- Typical Daily Orders: Data indicates Amazon customers place around 11.95 million orders globally per day.
- How Extensive Is Amazon’s Product Catalog? Amazon’s catalog includes well over 350 million products, with some estimates exceeding 600 million when accounting for all global listings and third-party sellers.
For a deeper dive into everything from product sourcing to listing optimization, you can visit Analyzer.Tools for a host of resources and expert insights.
Our Data Gathering Approach for 2025 Estimates
How Many People Use Amazon?
Global estimates suggest that over 309 million people use Amazon, with more than 200 million of those based in the United States. This huge user base stems from Amazon’s extensive range of products and diversified services. Its widespread adoption worldwide highlights its role as a leading online marketplace and service provider.
How Much Revenue Does Amazon Generate?
In 2024, Amazon generated approximately $638 billion in revenue. Based on historical growth trends of roughly 9.5–11% year-over-year and strong performance across retail, advertising, and AWS, estimates for 2025 point to a full-year revenue of about $700 billion. This projection underscores the company’s steady expansion and robust business model despite near-term challenges.
How Much Money Does Amazon Make Per Day?
Amazon’s operations yield an average daily revenue in the neighborhood of $1.3 to $1.4 billion. This impressive figure derives from annual revenue divided across 365 days, reflecting the company’s high-volume, round-the-clock business cycle. Such consistent daily earnings emphasize Amazon’s efficiency and global scale.
How Many Sellers on Amazon?
As of early 2025, around 9.7 million sellers are active on Amazon worldwide, with over 1.9 million of those operating in the U.S. This vast seller network is a crucial element behind Amazon’s extensive product range, facilitating competitive pricing and innovation. The platform’s ability to attract both small and large vendors contributes significantly to its marketplace dominance.
Typical Daily Orders
Based on multiple sources, the phrase "tens of millions per day" for typical daily orders can be reconciled with more precise data. In 2023, data from Capital One Shopping indicates that Amazon customers place around 11.95 million orders globally per day. Other sources note that U.S. shoppers alone contribute approximately 8.22 million daily orders. This suggests that while the "tens of millions" generalization holds true, a data-based fact for Amazon’s global order volume is in the 12 million orders per day range.
How Extensive Is Amazon’s Product Catalog?
Estimates of Amazon’s product catalog range from about 350 million to 600 million distinct items. This enormous inventory includes everything from everyday essentials to specialized niche products. The vast selection is a key competitive advantage, helping to attract a broad and diverse global customer base.
Our Data Gathering Approach for 2025 Estimates
To compile these 2025 estimates, we reviewed multiple reputable sources—including recent analyst reports, financial news articles, and company earnings statements. We focused on historically robust data, such as 2024 figures and growth trends, to project forward with careful adjustments for near-term headwinds like increased AI spending and softer sales forecasts.
There is, however, a degree of variability inherent in these numbers—for example, the product catalog count can fluctuate due to the dynamic nature of listings, and seller counts might differ slightly between data providers. By synthesizing insights from these diverse, credible sources, we arrived at the consolidated estimates provided above.
We’ve Grouped Key Amazon Data & Statistics Into Six Major Categories:
Each section answers questions like “How many people use Amazon?” and “How much does Amazon make a day?” This content is built to support anyone searching for Amazon statistics as well as professionals looking for reliable, up-to-date Amazon statistics, seller data, and market benchmarks.
1. Amazon User Base and Customer Metrics
Amazon's revenue figures are staggering—not just annually, but per day (and even per second!). In 2024 alone, Amazon generated about $638 billion, equivalent to roughly $1.75 billion daily. Whether it's through online retail, third-party seller fees, thriving cloud services (AWS), or booming advertising revenue, Amazon converts every second into significant dollars.
- Global Active Customers: Many third-party analysts estimate 300+ million worldwide, with a large chunk in the U.S. (some put it around 200–230 million, though exact figures vary).
- Prime Membership Worldwide: Amazon confirmed crossing 200 million global Prime members a couple of years ago, and it continues to grow.
- U.S. Prime Membership: Surveys often peg it between 120 and 150+ million—well over half of U.S. households, but not as high as 189 million.
- U.S. App Usage: The Amazon shopping app sees around 90–100 million monthly active users.
- Web Traffic: Amazon.com regularly pulls billions of monthly visits; in mid-2024, some trackers showed 3+ billion visits in the U.S.
- Prime Members Outspend Non-Prime: They often spend 2x or more compared to non-members.
If you want to dive deeper into how to find the right product opportunities in this vast user base, check out How to Find a Product to Sell on Amazon Without Guesswork.
2. Amazon Revenue Metrics
With Amazon, and you’re greeted by an inventory that feels almost infinite—a universe of products numbering between 350 and 600 million SKUs. More than 90% of these items come directly from third-party sellers, illustrating Amazon’s role as the ultimate retail platform for sellers large and small. This depth and variety dwarf those offered by traditional retail giants like Walmart and Target, redefining the meaning of consumer choice.
- Annual Revenue (2024): Amazon generated roughly $638 billion, based on public filings and analyst data. That translates to about $1.75B per day or $20,000 per second.
- 2024 Revenue by Segment (Approx.):
- Online Stores (1P): $247B (38.7%)
- Third-Party Seller Services: $156.2B (24.5%)
- AWS: $107.6B (16.9%)
- Advertising: $56.2B (8.8%)
- Subscriptions: $44.4B (7%)
- Physical Stores: $21.2B (3.3%)
- Other: $5.4B (0.8%)
- AWS Performance: A major profit driver, generating a large chunk of operating income.
- Advertising Growth: Over $50–56B annually, making Amazon the third-largest digital ad platform.
3. Amazon Product Inventory & SKU Count
No competitor quite matches the sheer scale and variety of Amazon's product catalog. The marketplace showcases an estimated 350–600 million items, with over 90% of SKUs offered by third-party sellers—far surpassing traditional retail giants like Walmart or Target. Amazon’s expansive catalog continues to fuel its industry dominance.
- Total Products Listed: Estimates vary from about 350 million to as high as 600 million+ if you count every variation.
- 1P vs. 3P Ratio: Third-party sellers account for well over 90% of total SKUs.
- Competitor Comparisons: Walmart.com’s range is in the tens of millions, while Target.com likely has far more than the 250k figure often cited.
- Top Categories: Home & Kitchen, Beauty & Personal Care, Electronics, and Apparel tend to rank highest in seller volume.
Looking for more tips on zeroing in on profitable niches? Check out Discovering Profitable Amazon FBA Niche Ideas (and Avoiding Duds).
4. Amazon Orders and Transactions
Amazon's orders flow nonstop—approximately 12+ million products bought every single day, with average order values ranging from $40 to $55. Major shopping holidays like Prime Day and Cyber Monday see these figures soar even higher, providing a captivating demonstration of capturing customers at speed and scale.
- Total Items Sold by U.S. Third-Party Sellers (2023): ~4.5B items, or about 12+ million items per day.
- Prime Day Figures:
- 2023: 375M items sold, $12.7B in U.S. sales (estimates vary by source).
- 2024: Over $14B globally, with hundreds of millions of units sold by third-party sellers.
- Average Order Value (AOV): Typically $40–$55 on normal days, slightly higher on big sale events.
- Cyber Monday / Black Friday: Over 400–500 million products sold in the U.S. during Thanksgiving to Cyber Monday.
- Orders per Second: Hard to nail down precisely; tens of millions of orders per day is certain, but “142 per second” may overcount items sold vs. orders.
5. Amazon Seller Statistics
The Amazon seller community is booming, with more than 9 million registered sellers around the globe, including roughly 1.8–2 million active sellers and approximately 1.1 million in the U.S. alone. Amazingly, over 2,000 new sellers join Amazon every single day. Driven largely by Fulfillment by Amazon (FBA), third-party sellers now contribute over 60% of Amazon’s total product sales.
- Number of Sellers: Third-party sources estimate over 9 million registered sellers worldwide, with ~1.8–2 million active. The U.S. alone has about 1.1 million.
- Seller Growth: Roughly 900K new sellers joined in 2024—over 2,000 a day.
- 3P Share of Sales: More than 60% of Amazon’s total product sales now come from third-party sellers.
- FBA Adoption: Roughly 82%+ of sellers use Fulfillment by Amazon.
- Top Sellers: A small fraction of large sellers drive a significant share of total GMV.
A 2025 report indicates that approximately 82% of Amazon sellers utilize FBA. Similarly, data from 2024 shows that 80%+ of sellers also use FBA as their fulfillment method. While the exact percentage may vary across different sources, it's evident that a significant majority of Amazon sellers incorporate FBA into their business operations
To learn more about product research techniques that help sellers break into these numbers, see Amazon Product Research: What It Is and Why It Matters. You might also explore strategies outlined in Top Free Amazon Product Research Tools for Budget-Conscious Sellers if you’re on a tighter budget.
6. Amazon Demographics and Engagement
Amazon’s customers aren’t just numerous, they’re actively engaged and ready to buy. Major user groups fall within the coveted 25–34 and 35–44 age ranges, with high household incomes typically exceeding $75,000 per year. Today, 50–60% of U.S. households have Amazon Prime memberships, and notably, more than half of U.S. online shoppers now bypass Google, beginning their product searches directly on Amazon.
- Largest Age Segments: 25–34-year-olds, followed by 35–44. Gen Z is catching up fast, but Millennials and Gen X remain the core.
- U.S. Prime Penetration: Often cited at 50–60% of households, though some sources differ.
- Income Levels: Many Prime households have incomes above $75K.
- Gender Split: Often around 53% male, 47% female in various surveys.
- Search Behavior: 50%+ of U.S. consumers start product searches on Amazon.
To further understand how to leverage Amazon’s massive user base, read What Is Amazon Market Research—and Why Does It Matter for FBA Success?.
Amazon Market Share and Growth
When it comes to market share, Amazon leaves rivals far behind, commanding around 38–40% of the U.S. e-commerce market and capturing up to 70–80% of transactions occurring on major online marketplaces. On a global scale, Amazon secures roughly 10–15% of worldwide online spending—a dominance fueled by strategic investments across advertising, logistics, and ambitious international expansion initiatives.
- U.S. E-commerce Share: Generally in the 38–40% range in 2023–2024, with incremental growth year by year.
- Marketplace Dominance: Amazon may capture 70–80% of major U.S. marketplace transactions (eBay, Walmart Marketplace, etc.).
- Global E-commerce Influence: Often pegged at 10–15% of worldwide online spending, with a GMV of $700–750B.
- Growth Drivers: Advertising, fulfillment logistics, off-site checkout (Buy with Prime), and international expansions keep Amazon on an upward trajectory.
Key Takeaways
- Massive User Base: Over 300M+ global customers; 100M+ Prime members in the U.S. by various estimates.
- Revenue Powerhouse: 2024 revenue hit $638B, with over $156B from third-party seller services alone.
- Huge Catalog: 350–600M+ products, with marketplace sellers listing most of them.
- Seller-Driven: Up to 9M+ total sellers, fueling the bulk of Amazon’s product sales.
- Top E-commerce Share: ~40% of U.S. online retail, well ahead of other competitors.
Why This Data Matters for Sellers
If you’re selling on Amazon—or planning to—these numbers should shape your approach. From sourcing decisions to logistics and advertising, the platform’s scale and momentum create both opportunities and fierce competition. To discover more about in-depth market research, see How to Combine Multiple Free Tools for Complete Amazon Market Research.
You can also swing back to the Analyzer.Tools homepage for additional data-driven tips and software solutions to refine your selling strategy.
Cite This Page
If you’re quoting Amazon statistics or analyzing e-commerce trends, feel free to reference this page. All figures are taken from Amazon’s financials, third-party research, and market analysts covering 2023–2025. We do our best to keep this regularly updated for accuracy.
References
Note:
All numbers are drawn from publicly available financials, third-party data tools, or analyst forecasts. Because Amazon rarely publishes exact active user or product counts, we rely on well-known research platforms for best estimates.
- AMZScout. (2024). Amazon statistics: Number of customers, sellers, and products. Retrieved from https://amzscout.net/
- BullFincher. (2025). Amazon revenue breakdown by segment (2024). Retrieved from https://bullfincher.io/
- Capital One Shopping Research. (2024). Third-party sellers on Amazon: Market share and growth trends. Retrieved from https://capitaloneshopping.com/
- CIRP. (2024). Amazon Prime membership penetration and growth trends. Consumer Intelligence Research Partners.
- eMarketer. (2024). Amazon market share forecasts for U.S. e-commerce. Retrieved from https://www.emarketer.com/
- Marketplace Pulse. (2024). Amazon seller growth, seller concentration, and order volume data. Retrieved from https://www.marketplacepulse.com/
- Statista. (2024). Amazon Prime membership demographics and app usage statistics. Retrieved from https://www.statista.com/
- Similarweb. (2024). Amazon traffic sources, gender breakdown, and app engagement. Retrieved from https://www.similarweb.com/
- Adobe Analytics. (2024). Prime Day and Cyber Week sales data and performance recap. Retrieved from https://business.adobe.com/resources/
- Adnabu Blog. (2024). Amazon seller count by country and fulfillment model adoption. Retrieved from https://blog.adnabu.com/