Break Even Amazon Sell Price, Thumbnails and Image Gallery
Analyzer.Tools update introduces customer requested updates which greatly enhance the efficiency of analyzing Amazon wholesale products for profit and sales history.
👉 Break-Even Sell Price added to historical charts and dedicated grid column
👉 Product thumbnail image is now always visible with added enhancements such as image gallery view to see all Amazon images.
- Quick demo (00:00)
- Break Even Sell Price Explanation and Demo (0:36)
- Thumbnails and Image Gallery Demo (3:12)
- Conclusion (04:10)
Break-Even Sell Price
Understanding the break even selling price on Amazon helps you determine the minimum price a product needs to sell for to cover its costs. This is important to ensure you don’t lose money on each sale. Using Analyzer.Tools, you can easily determine how long the product has been selling above the break even point in the the last 30, 90 or 180 days. This can dramatically reduce your risk when deciding which products to sell on Amazon.
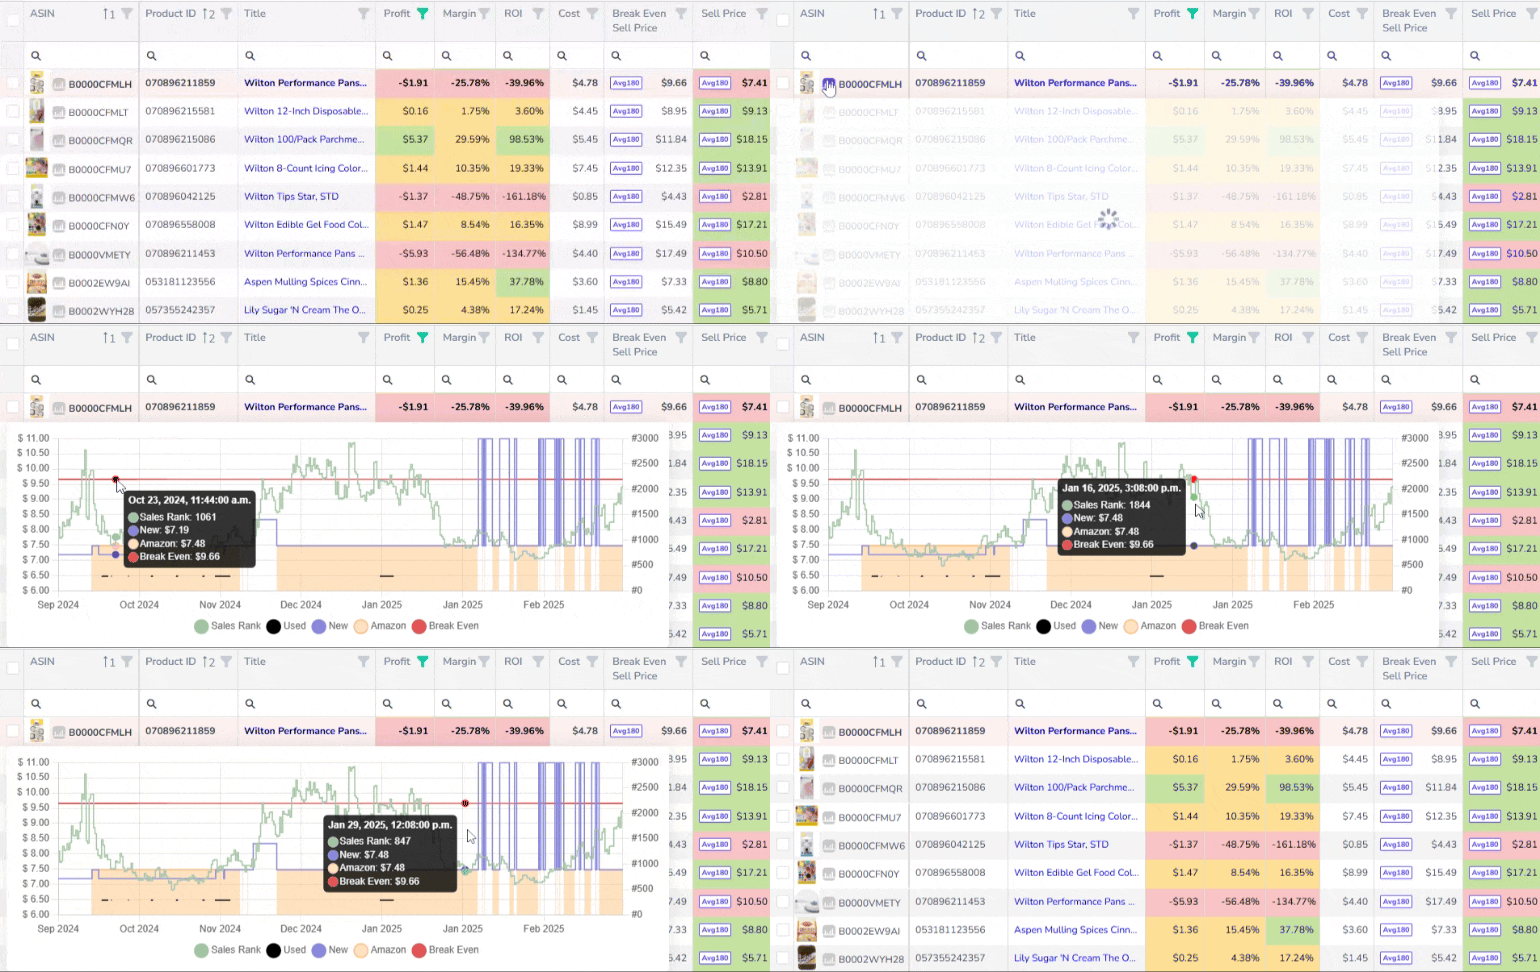
📌 Historical hover chart now contains break even $. You can clearly see the “New” selling price (blue line) is historically higher than the red “Break Even” cost which indicates steady profit potential!
Break even is added to the charts in the main grid as well as Product Detail pages. When in the grid, click on the hover chart icon to lock it in place, allowing your mouse cursor to interact with the chart.

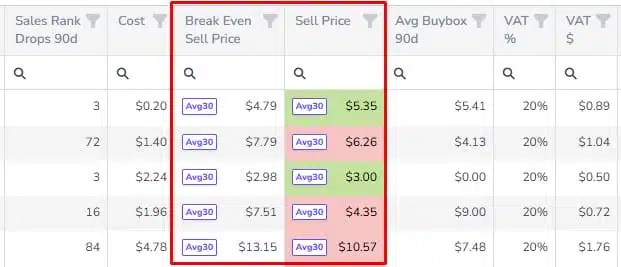
📌 Break Even Sell Price is also included as a dedicated grid column. For convenience, the Sell Price column is highlighted green/red to indicate whether Sell Price is higher (green) or lower (red) than Break Even.

📌 All of this data is dynamic which changes as other variables may change. For example, adjusting your Cost (COGS), Sell Price, Inbound Shipping, VAT, etc., will impact your Break Even Sell Price and Profit in the chart and grid instantly!
📌 This enhancement builds on Interactive Historical Charts which was previously released.
Product Thumbnails and Image Gallery
Product Thumbnails have been enhanced to improve the way you source wholesale products to sell on Amazon. Viewing an image of the product is pivotal for ensuring the product you’re viewing matches your supplier’s product as well as reviewing the quality (and value-add potential) of product listings on Amazon in general.
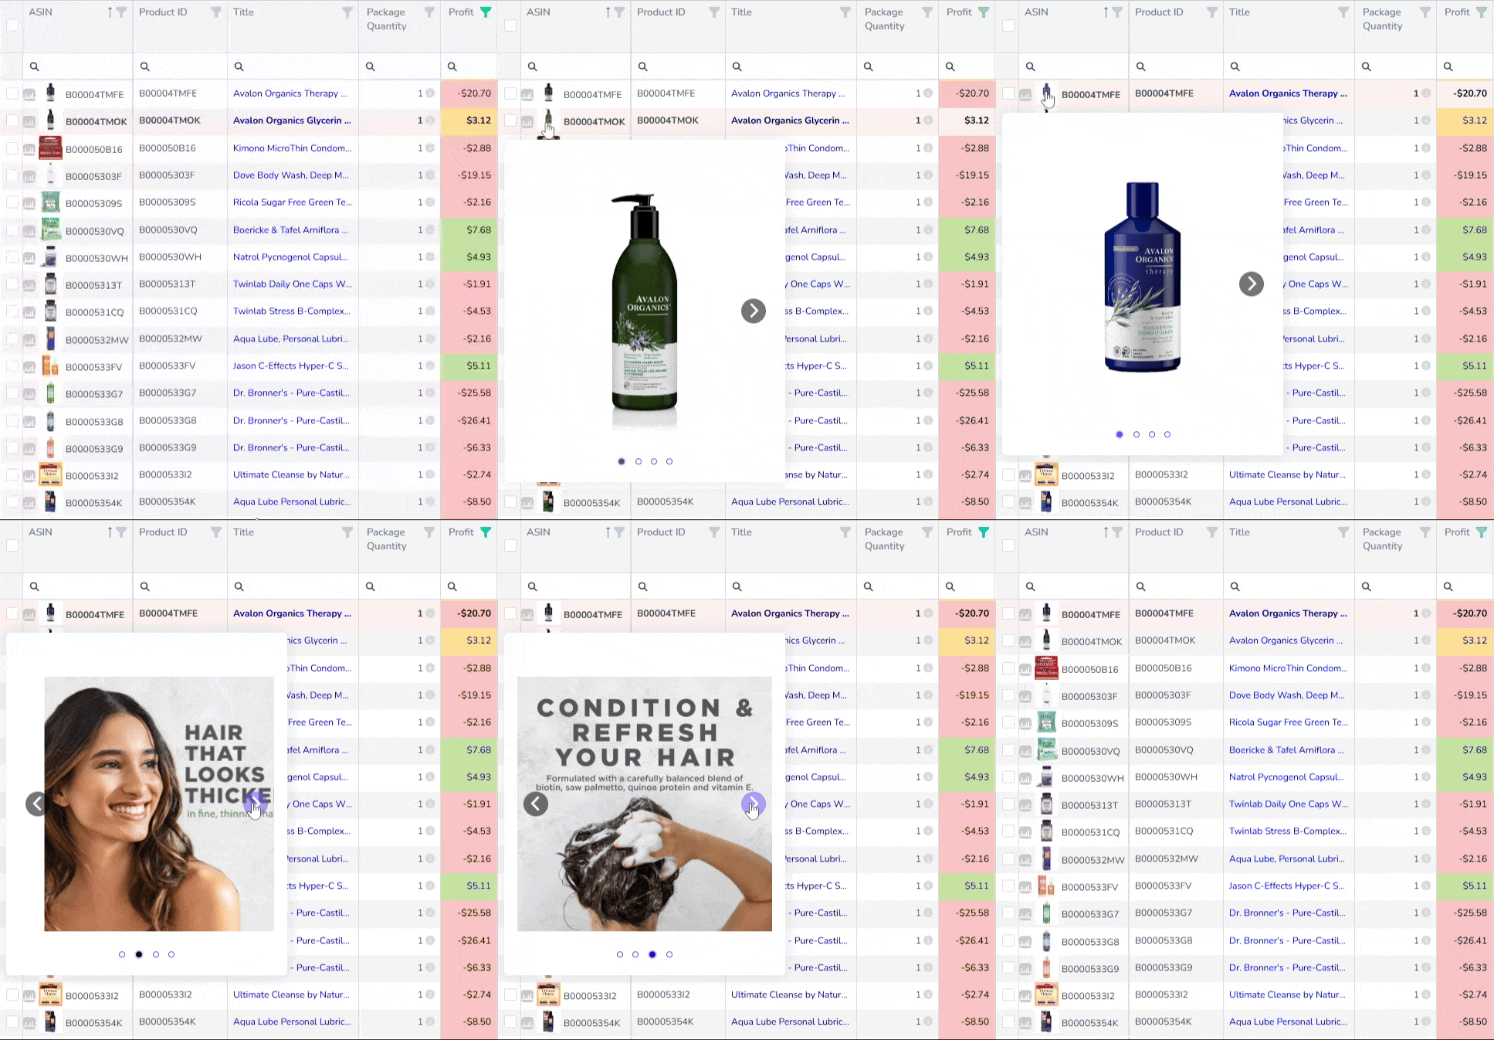
👉 Thumbnails are now always visible in the grid without hovering
👉 Hovering on thumbnails expands to a larger view of the product image
👉 Clicking on the thumbnail locks it in place, allowing access to product image gallery!

How to get Break Even Sell Price and Thumbnail Gallery for Amazon Wholesale Analysis
Break Even Sell Price is available with no additional charge on all Analyzer.Tools Web app plans. You can view our plans and sign up in the Pricing Table of the Analyzer.Tools website.
Please be sure to visit, subscribe and share our Facebook, YouTube & X page to be the first to get the latest updates on program developments and new features!