Using Averages for Estimated Sales and Sell Price
Using averages to calculate Estimated Sales and Sell Price is a game changer since it provides more accurate sales estimates and profit calculations which are adjusted for daily volatility. These setting options allow Estimated Sales to be calculated based on 30, 90 or 180 day Sales Rank averages. Similarly, Sell Price can be set based on the 30, 90 or 180 day average BuyBox. These are powerful features which deliver more accurate results by smoothing out daily fluctuations in Sales Rank and Sell Price.
- Introduction to how it works (00:23)
- Settings screen and detailed explanation (0:24)
- Example of how it works (01:10)
- Comparison of using averages vs live data (2:06)
- Conclusion (05:30)
👉 Have any questions or suggestions? Reach out to us!
👉 Please be sure to visit, subscribe and share our Facebook, YouTube & new Twitter page to be the first to get the latest updates on program developments and new features!
How Using Averages for Sales and Sell Price Improves Your Product Analysis
Daily swings in sales rank and pricing can make products look more profitable than they really are—or hide great deals that deserve a closer look. That’s where the new settings for using 30, 90, or 180-day averages come in. By relying on historical data instead of today’s numbers, you’ll spot hidden winners and avoid misleading duds.
Why Use Averages?
When you only look at the current sales rank or sell price, you get a snapshot of that moment in time. Products on Amazon fluctuate constantly—some jump in rank and price because of seasonality, stockouts, or sudden demand spikes. Others fall just as quickly.
By basing your estimates on longer-term averages, you’ll:
- Smooth out daily ups and downs
- Get a more accurate view of monthly sales
- Avoid chasing short-term trends that might fizzle
How to Switch to Averages
- Open Settings: Look for the options to enable averages for Estimated Sales and Sell Price.
- Choose Your Window: Decide if you want 30, 90, or 180-day averages.
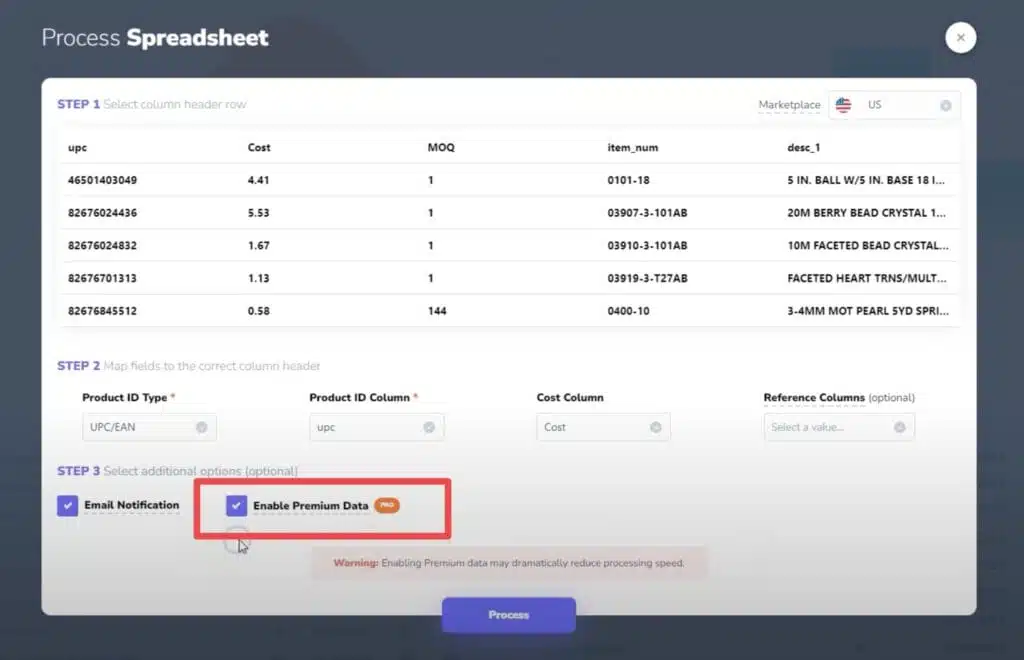
- Enable Premium Data: This is needed for historical data to work. Otherwise, the system defaults to the current number.
- Upload Your Spreadsheet: Process it like you normally would.
- Look for the Flags: Once the scan finishes, you’ll see tags showing which columns use averages.
Example 1: The “Fake Winner”
In one scan, the product showed:
- 30 sales/month using current data
- $0.77 profit
It looked pretty good. But looking at the 180-day average revealed:
- Fewer than 5 sales/month
- $3.75 loss
The product’s price and rank had wild swings—on one day, the sales rank was under 100K, on another it was over 400K. By using only the current snapshot, you risked choosing a losing product.
Example 2: The Hidden Gem
In another scenario, the product showed:
- 47 sales/month using current data
- $42 profit
But the 180-day average indicated:
- 85 sales/month
- Even higher profit
If you had filtered this item out based on current data, you’d have missed an even stronger performer that, in the long run, brings in higher profit and more sales.
Why This Matters
Relying on just today’s numbers can cost you money—or lead you to invest in a product that barely moves. Averages help you:
- Avoid chasing fleeting spikes
- Pinpoint more stable, long-term performers
- Look beyond what’s happening in a single moment
Bottom Line
Using averages for your estimated sales and sell price settings gives you a clearer, more reliable view of a product’s true potential. Daily data can be misleading—one day’s spike or dip might hide a product’s real performance. By looking at 30-, 90-, or 180-day averages, you’ll smooth out those swings, avoid bad buys, and uncover hidden gems you’d otherwise miss.
Also see: Amazon Statistics: A 2025 Look at Users, Sellers, Revenue, and Marketplace Trends
